
Life insurance products have an important role to play in supporting consumers’ dreams and aspirations as well as in mitigating their worst nightmares. However, with so many competing demands on consumers’ hard-earned cash, insurers face the perennial challenge of convincing a sceptical public of the need for cover.

The mystery of the protection gap
When asked whether they have any insurance covering life, accident, death, illness or disability, 69% of respondents answered Yes. On closer inspection, the effect of employment and education on the insurance penetration rate becomes clear.
Of those respondents currently in employment, the average insurance penetration rate is 81%, compared to 61% of those who are retired. This is consistent with the diminishing need for life insurance as consumers reach a stage in life when financial responsibilities reduce – and the cost of cover for seniors increases significantly as age rises.
Education levels show a similar correlation. Amongst those respondents claiming to have an undergraduate or post-graduate degree or a professional qualification, insurance penetration is 75% – the corresponding penetration rate for those with a lower educational level is just 57%. This difference points to the value of financial literacy – those with a certain level of education, and the income that generally attaches to it, are more likely to understand the power of protection and have the ability to pay for it.
Interesting differences also emerge in the profiles of respondents between the established markets and the growth markets. Just 50% of respondents in established markets reported being in either full-time employment or self-employment, with 18% either retired or semi-retired. Corresponding figures for the growth market were 72% employed and only 5% retired.
The numbers diverge again when considering education level: 67% of established market respondents claimed to be educated to undergraduate or post-graduate degree level or have a professional qualification, compared to 77% of growth market respondents. This indicates that, while the survey sample was stratified to represent the age and gender structure of the underlying populations, it is likely that there remains a marked economic bias in the growth market samples.
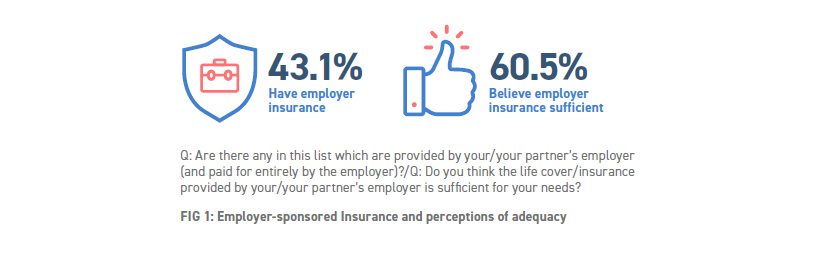
Consistent throughout all markets, employer-sponsored cover remains an important source of protection, with 43% of respondents saying that they had cover arranged through their, or their partner’s, employer. Whether from established or growth markets, 60.5% of the respondents (Fig 1) who had employer-sponsored cover thought that the benefit provided was sufficient.
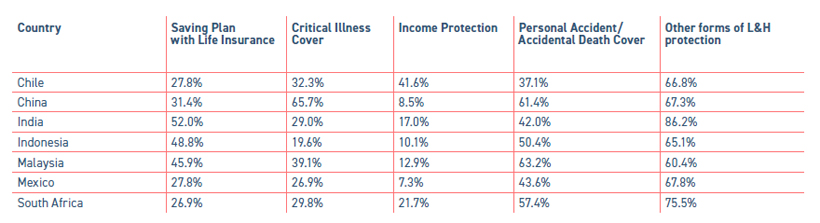
India stands out amongst all the markets with 73% of respondents claiming to receive insurance coverage from their employers. Upon closer examination, it is apparent that the Indian survey sample is dominated by respondents of high educational achievement. 87% of Indian respondents described themselves as having an undergraduate, postgraduate degree or a professional qualification. This clearly represents an education level bias for Indian respondents, compared to the Indian national average. The response data from India in this report should therefore be more accurately read as “Educated India” consumers.
Moreover, with recent growth in the Indian insurance industry, primarily driven by government sponsored mass schemes, it is of little wonder that insurance product ownership amongst Indian respondents is very high – albeit that, by any objective measure, the level of benefits provided may not be truly adequate.
The product landscape is mixed
The product mix will be influenced by a range of factors that will not apply uniformly to all of the countries covered in this survey. These will include, amongst other things, the strictures of insurance regulation and fiscal policy – whether, for example, products confer any tax advantage.
Clearly the mix of products will be dependent upon the range and nature of the products on offer and, indeed, upon the competition from other sectors of the retail financial industry. In a number of the established markets – of which the UK is a prime example – the savings market has been surrendered, almost in its entirety, to the fund management industry whereas, in many growth markets, life insurance is still one of the few avenues for individuals to access non-deposit savings.
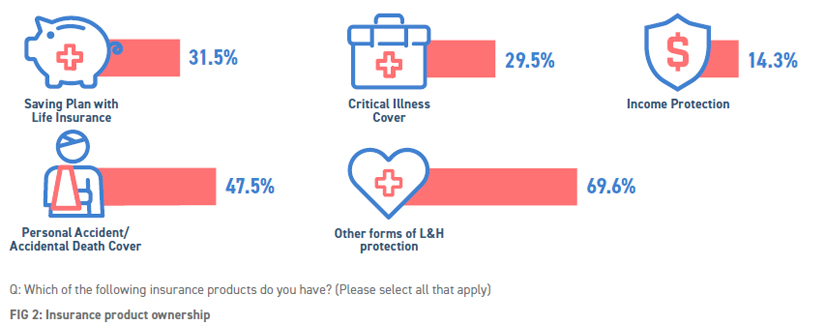
By comparison, take-up of income protection remains low. Only 14% of respondents reported having this cover (Fig 2), despite the fact few would be able to face the prospect of long-term sickness or injury without serious detriment to their financial wellbeing. But, while the need and potential demand are clear, supply-side issues may still be a barrier to progress. Designing products that are both profitable and consistent with customer needs and expectations has proved to be an enduring challenge. In addition, salespeople have been wary of selling the product because of the more stringent underwriting standards and the potential for dispute over claims – either of which might put client relationships at risk.
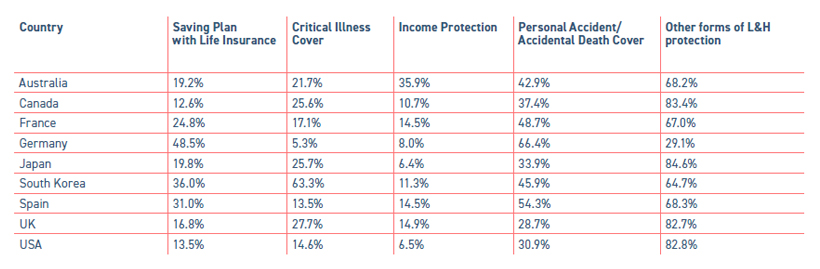
Established Market
Growth Market
Trust needs real people
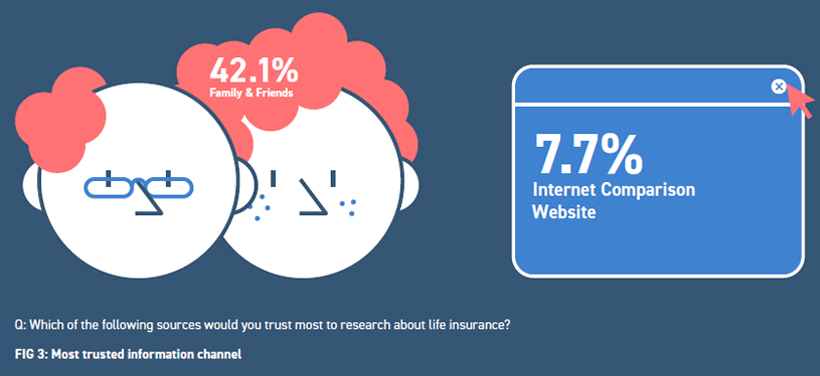
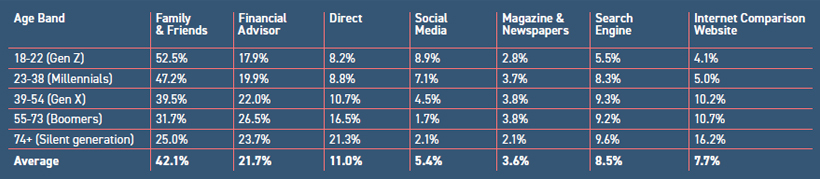
Consistent with the results of our previous surveys, the online world is not the first source of information when it comes to research of life insurance products. Consumers in nearly all countries continue to place greatest trust in advice from families, friends and financial advisers. This reliance upon family and friends decreases with the age of the respondents. Approximately 50% of those surveyed under the age of 38 cite this as their primary source of information, while the corresponding proportion of the over 65s falls to 30% (Fig 3).
Of those identifying a trusted source outside the circle of family, friends and financial advisers, we observe some variance amongst different markets. Internet comparison websites rank within the top three sources in Germany, Spain, South Korea and Chile. Elsewhere, the other most favoured source of information to have popular support is the insurer’s website.
So, despite the prevalence of social media in our daily lives, these channels have yet to play a significant role for any generation in the gathering of trusted information.
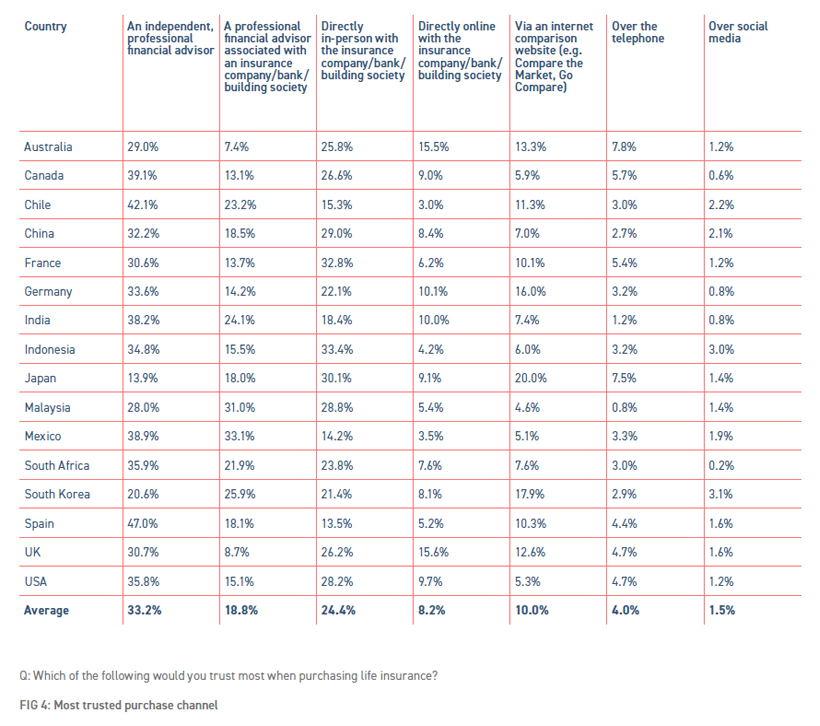
When it comes to purchase channel preference, independent financial advisers enjoy the greatest trust in 12 of the 16 markets surveyed (Fig 4). The exceptions are France and Japan, whose respondents appear to favour direct purchase by mail or in person at a branch of a bank or insurance company, and Malaysia and South Korea where bank/insurance company agents received the greatest number of nominations.
In the majority of countries, completion either online or via a comparison website receives relatively modest acceptance. The respondents who place the greatest trust in these avenues for the purchase of insurance are those from Australia, Germany, Japan, South Korea and UK. Japan is notable in that, whilst 20% of its respondents nominated comparison websites as the most trusted channel for completion – the largest proportion in any of the markets surveyed – just 12% thought these sites to be the most trusted source of information.
Calling for a faster, easier purchase experience
Price remains the no.1 factor when buying life insurance, with 46% of respondents saying this is the most important feature when making a decision. Convenience is also valued, with 26% looking for a hassle-free process, whilst 7% are primarily concerned with the speed of the acceptance process.
There are interesting generational differences to note. For the 18-22 (Gen Z) age band, a hassle-free process comes out as being equally important to price, with speed of completion valued more highly by this group than by older respondents. However, with each successive age group, price assumes ever greater importance at the expense of process or speed of completion. Amongst the over 55s, competitive pricing is rated to be the most important factor by 55% of respondents whilst just 20% are primarily concerned with the ease of the process.
Brand reputation also features highly, with 19% of respondents rating this as the most important factor. However, Chinese respondents stand out as being the most brand-conscious with over 50% rating this to be of primary importance.
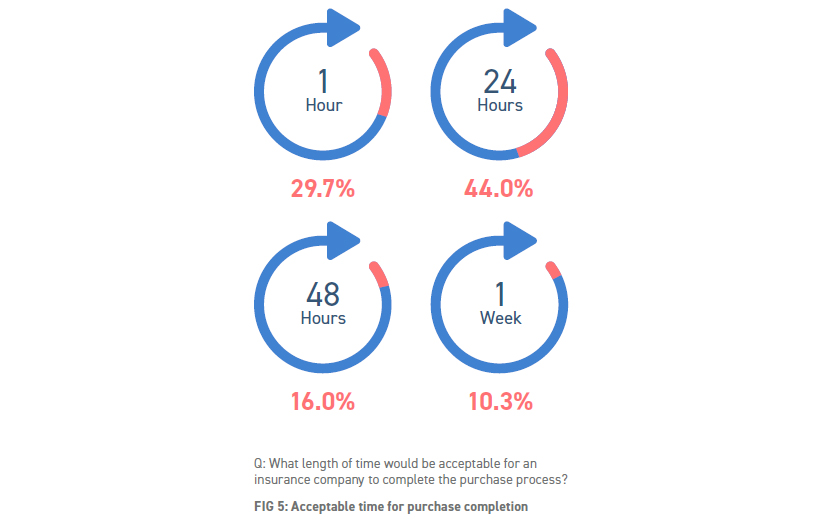
Although speed of completion was a principal concern for only a minority, respondents nonetheless expect the acceptance process to be completed quickly (Fig 5). 74% of respondents expect to complete the purchase within 24 hours, with a significant 30% expecting completion in less than an hour. Just 10% would be happy to wait more than a week.
The route to happiness
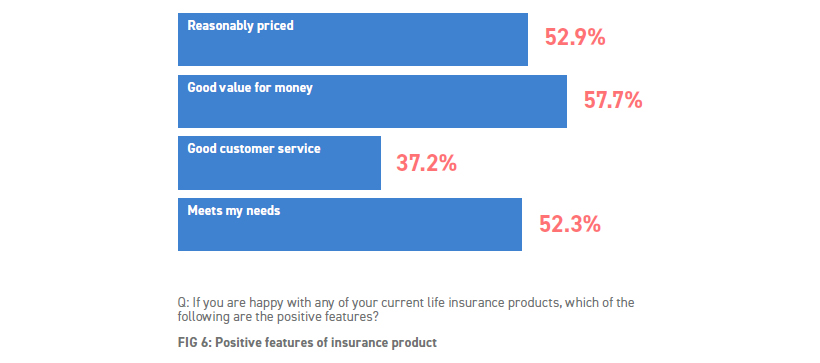
The survey asked respondents whether they are happy with their current products and, if so, which features gave rise to their satisfaction. The response was a ringing endorsement of customer satisfaction with 76% of respondents expressing contentment with their life insurance products. Respondents from the growth markets were more enthusiastic than those from the established markets, with an 84% satisfaction rating compared with a more modest 70% of respondents from the established markets.
And the cause of this contentment? 58% thought their insurance offered good value for money, with 53% saying it was reasonably priced and 52% citing the fact that the product meets their needs as a reason for their satisfaction. Customer service got fewer mentions with 37% flagging this as a positive feature of their customer experience (Fig 6).
On the other side of the scale, those who are not happy with their existing products were asked to indicate the cause of their dissatisfaction. This proved to be almost a mirror image, with more than half (52%) thinking that their products represented poor value for money, 46% saying cover was too expensive and 33% feeling that it didn’t meet their needs, while just 24% put their dissatisfaction down to poor customer service (Fig 7).
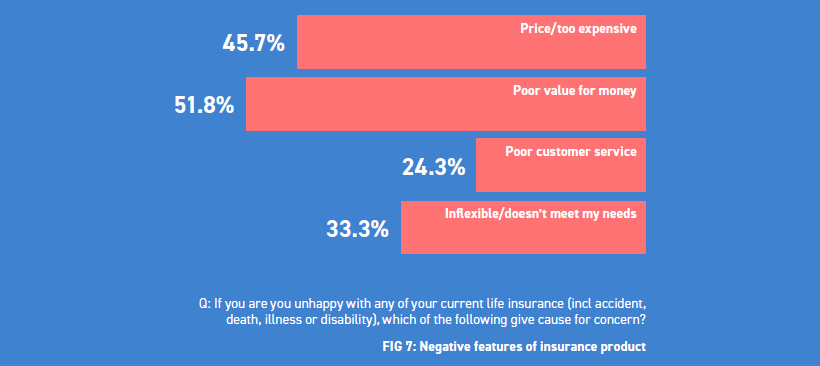
This suggests that, for many people, whether they love or hate their life insurance, the sentiment will often come down to price. That customer service takes a less prominent place in forming customers’ perceptions is perhaps a reflection of the fact that insurers, generally, have few interactions with their policyholders during the lifetime of a policy.
At your service
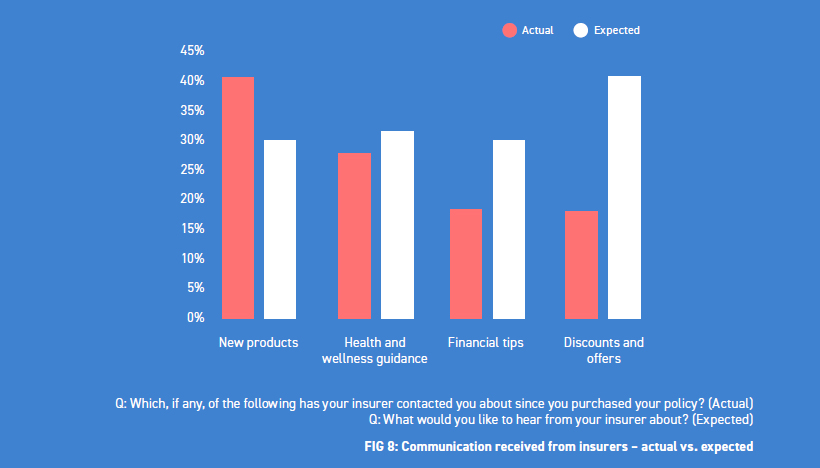
To gain a better understanding of the level of contact that might be expected by life insurance customers, the study looked at four areas of information, comparing what customers might hope or expect to receive after purchase with the information they actually had received.
The only area where the amount of information received exceeded that which was expected was for new products, with 31% expecting this compared to 40% actually receiving it. One suspects that this is a case where exceeding expectations should not necessarily be taken as a positive endorsement. On the other hand, 41% had expectations of being offered discounts and other offers while only 20% actually received them (Fig 8).
Whether respondents are living more in hope than expectation is not clear, but it does indicate that if insurers can forge arrangements with other providers of goods and services this could provide a positive influence on customer relationships.
Insurers fared somewhat better at meeting consumer expectations regarding the provision of health and wellness guidance with experience being very close to expectation. Significantly, nearly a third of consumers consider health and wellness guidance to be part of the life insurance proposition.
Respondents were also asked about the frequency with which they might expect to receive information from their insurers. A large majority (more than two-thirds) suggested that they would welcome contact once a month – another hint to insurers that their customers have a willingness to engage if they can provide relevant services and information.
This article is part of ReMark’s latest study of consumer behavioural trends in the insurance industry, dated October 2019