2021 Atlantic Hurricane Season: Another active year?
As the season begins, consensus points toward an above-normal season
21 juin 2021

The Atlantic hurricane season officially begins on 1 June and ends on 30 November, with August, September and October representing the busiest three months.
At least 20 research groups, private companies and universities produce seasonal hurricane forecasts. This article provides commentary on these forecasts, explaining the main drivers underlying them for the North Atlantic basin and the implications for landfall estimates.
As of the beginning of June, consensus favours an above-normal hurricane season with medium confidence. Two factors support this forecast, along with our level of conviction: lower expected sea surface temperature (SST) across the Niño 3.4 region (Figure 1) and higher expected SST in the tropical North Atlantic. The medium confidence is due to uncertainty as to whether ENSO (El Niño – Southern Oscillation) conditions for August, September and October (ASO) will be neutral or La Niña.
This year, NOAA revised the definition of a normal season, reflecting higher average values for the period 1991-2020 (Table 1). According to NOAA, this increase is attributed to better observing platforms, climate change and many years of a positive Atlantic Multidecadal Oscillation (AMO) within the 1991-2020 period.
Table 1 - Previous and current definitions of normal hurricane activity by NOAA
| 1981 - 2010 | 1991 - 2020 |
|---|---|
| 12 named storms | 14 named storms |
| 6 hurricanes | 7 hurricanes |
| 3 major hurricanes | 3 major hurricanes |
2021 forecasts
Table 2 below summarizes hurricane forecasts from three established groups. These are Colorado State University (CSU), National Oceanic and Atmospheric Administration (NOAA) and Tropical Storm Risk (TSR). Forecasts exceed the 1991-2020 average, with consensus among the three groups for the seasonal forecasts of named storms, hurricanes and major hurricanes.
Table 2 - 2021 hurricane forecasts from three forecasting groups and 1991-2020 averages
| Named storms | Hurricanes | Major hurricanes | |
|---|---|---|---|
| CSU | 18 | 8 | 4 |
| NOAA | 13-20 | 6-10 | 3-5 |
| TSR | 18 | 9 | 4 |
| 1991-2020 average | 14 | 7 | 3 |
In line with the hurricane forecast for the Atlantic Basin, CSU predicts that the probability of a hurricane landfall in the USA is 69%, above the long-term average of 52%. According to TSR, two hurricane landfalls are expected in the USA, which is the same as the long-term average.
El Niño is one key predictor of hurricane activity, playing an important role in seasonal hurricane forecasts. In general, positive El Niño is associated with increased wind shear in the Western part of the tropical North Atlantic, which in turn suppresses the development of tropical storms. Conversely, La Niña conditions favour such development. As shown in Figure 1, the forecast SST in the Niño 3.4 area for ASO 2021 is below-normal, indicating possible La Niña conditions (i.e., when the 3-month averaged SST anomaly increases above 0.5 ⁰C).
The model prediction shown in Figure 1 (NCEP Coupled Forecast System model version 2, CFSv2), is one of many models considered, while Figure 2 shows the plume of El Niño predictions (as at May) for ASO 2021 from various models. It is more likely than not that below-normal SST will be observed in this period. El Niño conditions are predicted as very unlikely for the ASO period, with uncertainty as to whether La Niña or near-neutral conditions will prevail.
Another factor that affects hurricane activity is the SST in the tropical Atlantic Ocean. The precise area used for the forecast depends on the forecasting group. The Main Development Region (MDR) depicted in Figure 1 is often cited as an important area for tropical storm development. Higher SST favour tropical storm formation and development. The SST forecast for the MDR is above-normal (Figure 1), and this is another factor expected to contribute to above-normal hurricane activity. Like El-Niño forecasts, the SST forecasts for the Atlantic also have considerable spread.
Figure 1: Forecast SST anomaly for ASO 2021
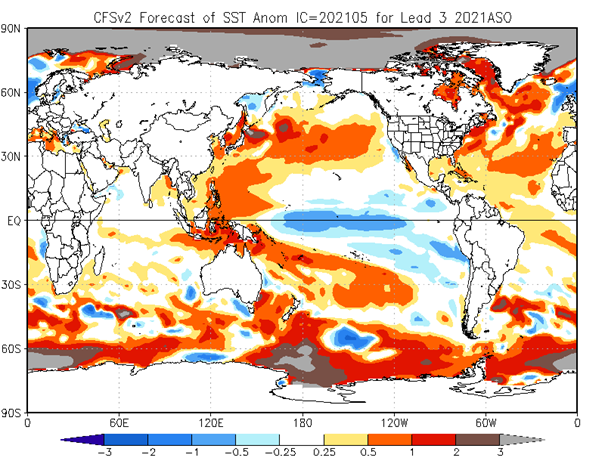
The pink rectangle indicates the Niño 3.4 region in the Pacific
while the green rectangle indicates the Main Development Region (MDR) in the Atlantic.
Courtesy NOAA/National Weather Service
Figure 2: Model predictions of ENSO from May 2021
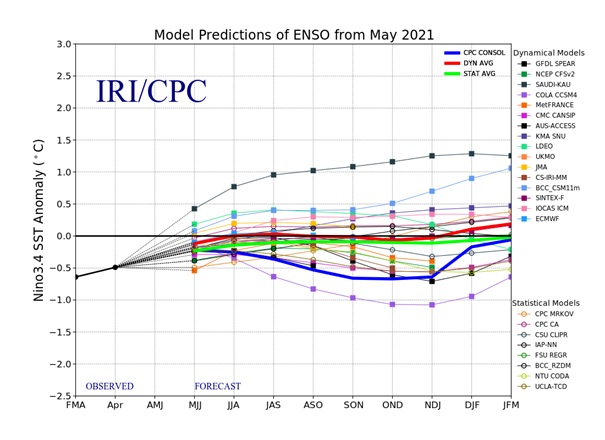
The blue arrow indicates the prediction for August, September, October, the period of peak hurricane activity.
Values below –0.5 indicate La Niña conditions, while values above +0.5 indicate El Niño conditions.
Courtesy IRI/CPC
Forecast skill
Some forecasting groups have been issuing seasonal forecasts for many years, so it’s possible to assess the forecast skill of their late May / early June forecasts over time. This is done using a Mean Squared Skill Score or MSSS, a percentage value that facilitates comparison between a forecast and climatology, i.e., average weather patterns over time. Positive values indicate that a forecast performs better than climatology (with MSSS = 1 for a perfect forecast), while negative values indicate that a forecast performs worse than climatology. Figure 3 shows the MSSS for NOAA, TSR and CSU for four forecast times: December, April, June, and August. We can see that for the June lead time all forecasting groups have a moderate skill score, outperforming climatology. This means that the late May / early June seasonal forecasts can be used in assessing risk transfer deals.
Figure 3: Mean Squared Skill Score (MSSS) of hurricane numbers for three forecasting groups and various lead times
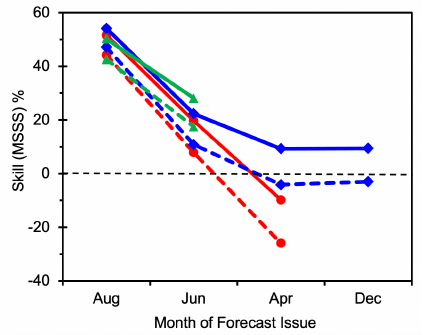
Courtesy: TSR pre-season forecast for North Atlantic hurricane activity (issued May 27, 2021)
Use in decision-making
As mentioned above, seasonal hurricane forecasts can support risk transfer decisions, which is why they are of interest to (re)insurers. However, given the mid-year timing of US wind reinsurance renewals, and the fact that forecasts with acceptable predictive skill only emerge in late May / early June, there is only a small window to influence these decisions.
So, what types of decisions could benefit from such intel? In our view, it does not add value in cases where a decision on whether to buy more or less (re)insurance is already clear from the modelling analytics and claims experience. Rather, these additional inputs offer value where the decision is borderline. This could include whether to add or remove prepaid reinstatements, whether to include aggregate protections that inure to the benefit of the main CatXL programme, or whether to extend or reduce where the programme caps out.
For the 2021 hurricane season, apart from an above-normal forecast, claims inflation is another concern for the industry. Increases in the cost of building materials, due to increased demand for larger homes and supply chain bottlenecks, is likely to feed through to building reconstruction costs and associated costs such as additional living expenses.
For these reasons, where reinsurance buyers and risk managers are in two minds about increasing coverage, perhaps this intel will help.