The cost of catastrophes
Junaid Seria looks back on 2017, a record year for devastating weather events in The Actuary, the magazine of the Institute & Faculty of Actuaries.
12 mars 2018
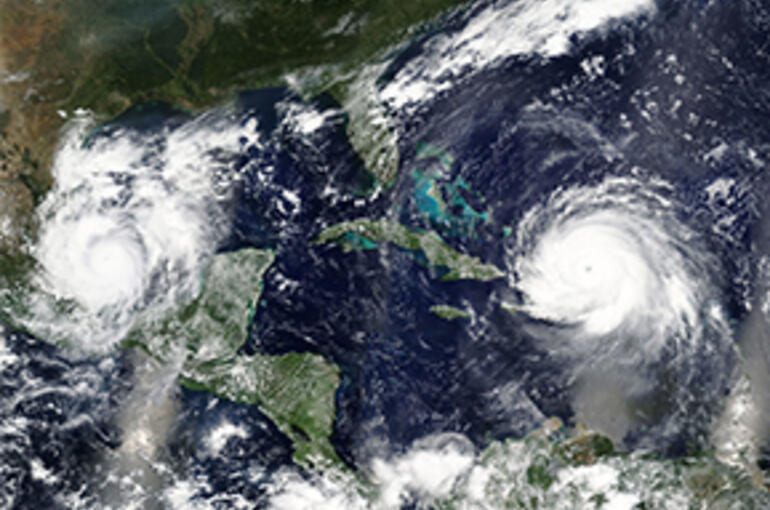
With an estimated global economic loss of $353bn, 2017 is set to become the second-costliest year on record for natural disasters behind 2011. If considering only weather disasters, it is the costliest year ever. Weather-related insured losses are estimated at $134bn, $3bn shy of 2011 on an inflation-adjusted basis. Some 60% of global insured losses came from three US landfalling hurricanes: Harvey, Irma and Maria (HIM).
While hurricanes dominated global losses, 2017 saw record wildfire losses (notably from California, Portugal and South Africa), above average storm losses, and two major earthquakes in Mexico. While capital impacts for some risk carriers reached around 30% of year-end 2016 shareholder equity, the global reinsurance industry demonstrated its resilience with adequate surplus capital of around $600bn at Q3 2017.
HIM hurricanes
During the past few years, there has been a dearth of category 3+ US landfalling hurricanes – 12 seasons since the record-breaking 2005 season of Katrina, Rita and Wilma (KRW). The 2017 hurricane season seems to confirm the lucky streak is now over, with HIM generating as much as $90bn of insured losses.
Hurricane Harvey’s impact at landfall was relatively modest, hitting a stretch of Texas coastline that was not heavily exposed. Damaging winds and storm-surge-induced flooding were expected to be ‘only’ a few billion dollars, but what followed were record levels of rainfall over Houston, the US’s fourth most populous city. The extreme levels of rainfall are illustrated in Figure 1 below.
The flooding made loss estimation difficult, as the two main catastrophe modelling vendors do not have inland flood components in the hurricane models yet.
Irma broke records for sustaining extremely high wind speeds (>180mph) for 37hrs, beating Typhoon Haiyan’s record (24hrs), and tested the nerves of the reinsurance movers and shakers who were assembled at the Monte Carlo Rendez-Vous. Having wrought massive destruction in the Caribbean, Irma was category 5 for a time with a track that was pointing towards Miami – a scenario that could easily have generated the first $100bn+ storm. Thankfully, a shift in direction spared Miami and reinsurers from the worst. Recall also that the landmark hurricane Andrew (1992) made a similar last-minute shift in track 25 years prior (almost to the day).
Puerto Rico was affected by Irma, but Hurricane Maria was worse. Maria made landfall as a category 4 hurricane, the strongest storm to hit since 1928. The island was already in financial difficulties, with a vulnerable infrastructure. Hundreds of thousands of people are still without electricity and clean running water, impeding normal business conditions for businesses and their workers.
Pharmaceuticals and biomedical are the major industrial manufacturing sectors on the island, and while there were relatively minor property damage (PD) losses, there have been significant and ongoing business interruption (BI) losses. A high ratio of BI to PD losses is difficult to relate back to CAT models, where BI is typically calculated as a function of PD.
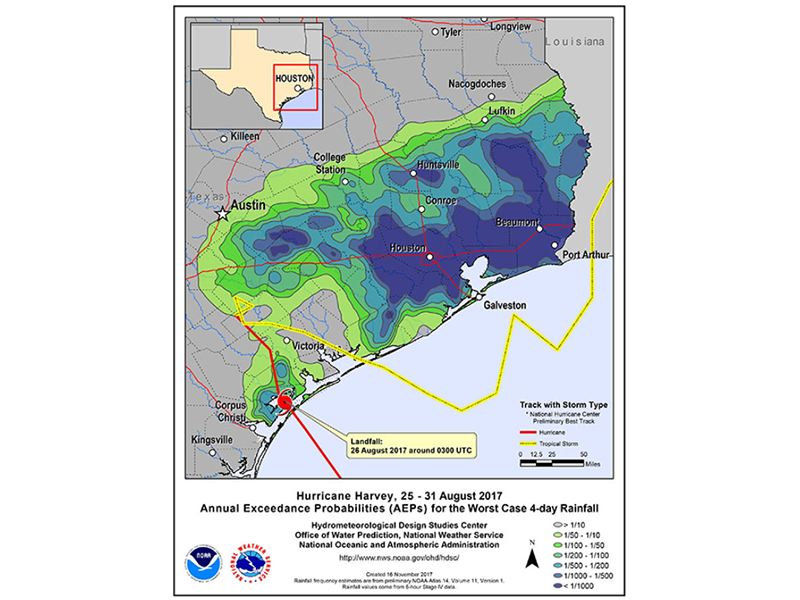
Figure 1
The link to climate change
An active hurricane season has led many to ask whether climate change had a role to play. The climate is changing at a faster rate than it has in over a million years, with a clear trend of global temperature increases.
This will inevitably lead to volatility of weather and unanticipated second-order effects. Sea-level rises, increasing sea-surface temperatures, ocean salinity and Saharan dust all influence the formation and maintenance of hurricanes, and are all being affected by climate change.
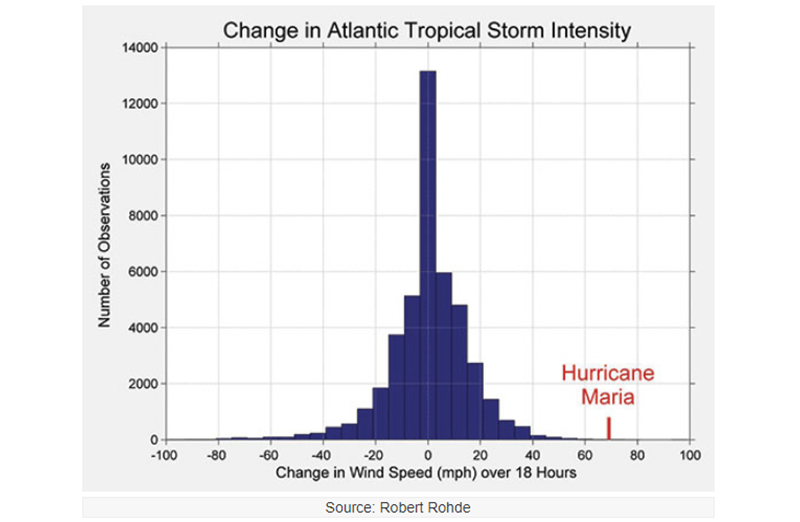
Figure 2
The academic community continues to debate the specifics of how hurricane frequency and intensity will change. Over the long term, some scientists expect longer hurricane seasons. Others argue that global warming will lead to reductions in hurricane frequency but higher hurricane intensity, due to higher sea surface temperatures.
The 2017 hurricane season presented a few clues about potential future effects of global warming. Some scientists argue that Harvey’s extreme rainfall was exacerbated by climate change.
Maria underwent a process of rapid intensification (as shown above in Figure 2), and some scientists argue that rapid intensification prior to landfall will become more frequent in the future. Hurricane Ophelia, the 10th of the 2017 season, became the eastern-most Atlantic hurricane on record. A warmer Atlantic in the future may support more hurricanes like this.
SCOR hurricane analysis
Irma’s forecast versus its actual track raised questions about how much worse losses could have been had Irma hit areas of higher asset concentration (for example, Miami). Harvey raised questions about how important it is to explicitly model rainfall when anticipating future hurricane losses. The SCOR R&D department teamed up with the SCOR Chicago office to perform a short analysis around these questions.
Irma, a near (Miami)-miss
To identify a set of plausible Irma-like scenarios, we started with a set of forecast tracks from two meteorological agencies, with a forecast position initialised when Irma passed over the Turks and Caicos Islands (see Figure 3). These tracks were selected based on a best estimate of the atmospheric state at that time. From this plume of tracks, we narrowed down the tracks to those that had a similar trajectory to Irma and Category 3+ intensity, including both landfalling and bypassing loss-causing events. We estimated gross industry losses from the set of identified stochastic events.
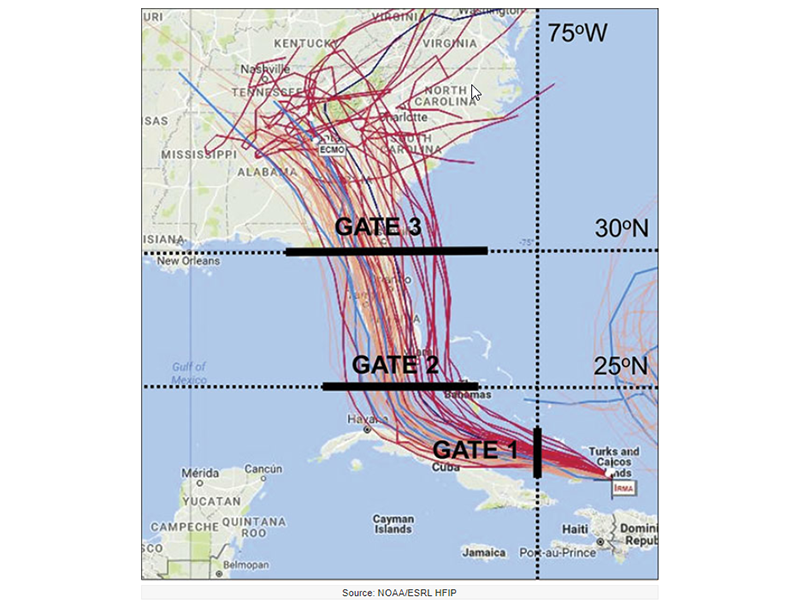
Figure 3
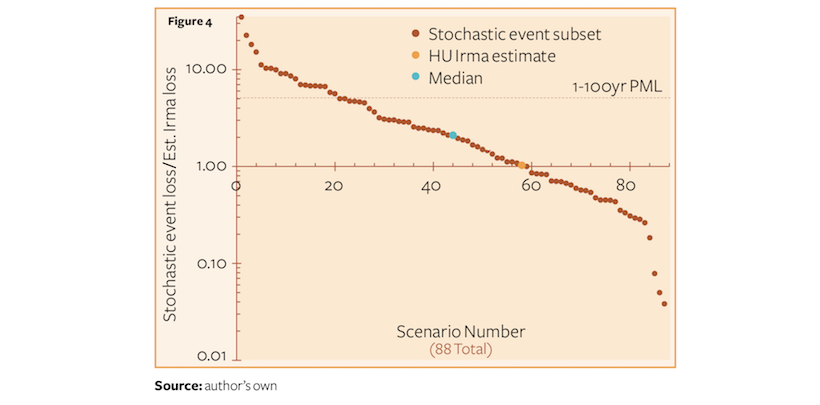
Figure 4
Figure 4 illustrates our results, with losses normalised by the actual Irma estimate, expressed on a log scale and ranked from highest to lowest. There is a wide spread in loss severity, with losses many times worse for category 5 events hitting, say Miami and/or Orlando. Approximately 20 events exceed the industry 1-in-100-year probable maximum loss (PML) for Florida. There are also several scenarios with lower losses. However, the position of the actual event in the range of scenarios is perhaps more insightful. If we consider this to be a credible range of plausible realisations, the graphic clearly shows more severe scenarios than optimistic scenarios, suggesting we were indeed ‘lucky’ on this occasion.
Harvey – causes and comparison against HURDAT
Harvey was the most significant tropical storm (TS) rainfall event in the US since reliable rainfall records began around the 1880s. Its centre remained over the Texas coast for four days, dropping more than 60 inches of rain over parts of south-eastern Texas.
Harvey’s extreme rainfall can be attributed to two key factors; its slow forward speed and unusually long lifespan, post-landfall. Meteorologists point to the existence of two high-pressure systems that blocked Harvey’s north-westward motion. This led to a positioning over both land and sea, which allowed it to keep drawing moisture from the ocean and then dumping it inland.
Based on these observations, we attempted to isolate two parameters in the HURDAT2 dataset, namely storm persistence or duration and average forward speed post-landfall. Given that tropical cyclone rainfall levels are higher for Texas, Louisiana and Florida Gulf States, we confined our analysis to landfalling storms in these states.
Figures 5 and 6 below illustrate Harvey’s relative position in the distribution of observed storm durations and average forward speeds, post-landfall. For duration, Harvey ranks in the worst 1%, while for average forward speeds Harvey is among the slowest 10% of storms.
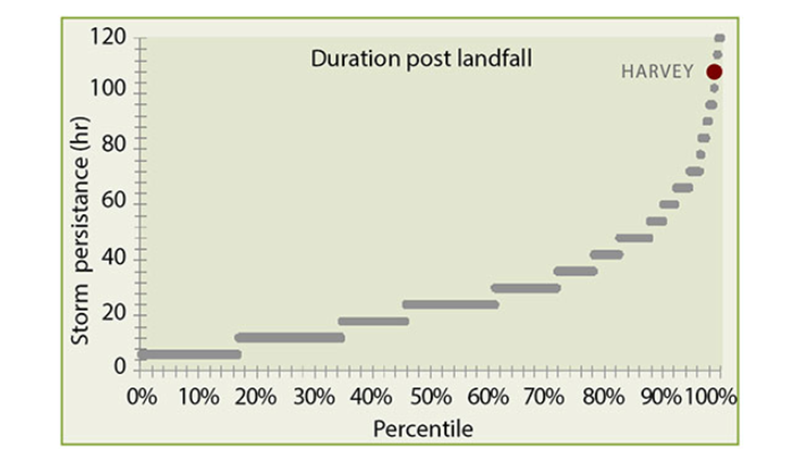
Figure 5
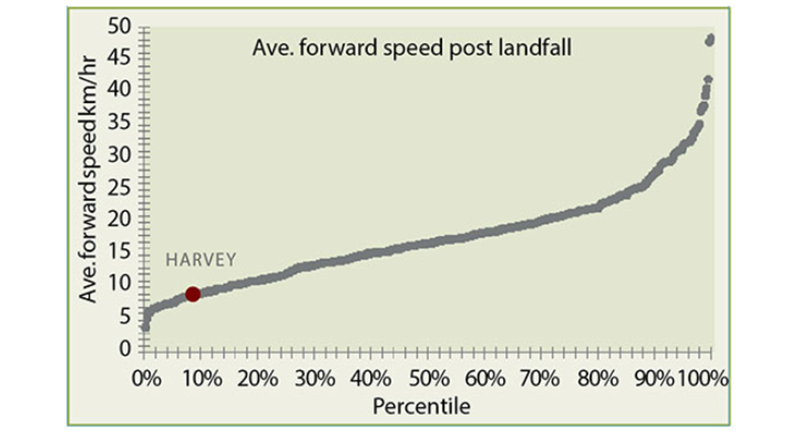
Figure 6
Are Harvey-like events appropriately represented in hurricane models?
Catastrophe model vendors tell us that hurricane-induced rainfall-driven flooding is implicit in their models. Their rationale is that, in the calibration of wind vulnerability, one cannot separate out flood. While this is sensible, the question is whether the implicit allowance is appropriate.
Rainfall data from the Weather Prediction Centre allows a comparison of storm duration and average forward speed against maximum rainfall recorded. Our analysis finds there is some skill in using these two parameters, particularly for tropical cyclones lasting more than two-and-a-half days and/or moving slower than 15 km/hr. As hurricane models include stochastic events that are slow moving and persisting, one could isolate qualifying events based on these pre-defined thresholds and then apply a more explicit load.
While far from perfect, this loading method has several benefits. The approach is easy to understand and communicate and could be considered more stable than experience-pricing methods. As the loads are applied to the stochastic event set, treatment of flood would be consistent across pricing, exposure management and capital, assuming systems are aligned. An in-house method such as this provides some choice, should you wish to use different vendors for modelling hurricane and inland flooding.
Lessons (to be) learnt
There are many lessons from 2017, some of which are already clear, while others are still in the process of being understood.
With Maria, the focus has been on business interruption. Puerto Rico reminded us that for industries like pharmaceuticals, where quality control is essential, the requirement for inspection and re-certification can add significant time and cost to fully restarting operations after ‘clean-room’ conditions have been breached. We are also learning more about the dependencies within an insured’s internal supply chain.
With Harvey, the focus has been on flood. As well as highlighting the model limitations, Harvey also revealed the gaps in flood coverage data provided in reinsurance submissions. Both models and data for flood need to improve if we want to close this key protection gap.
Commercially, the reinsurance industry was reminded that three $30bn events behave quite differently compared with a single $90bn event in terms of risk transfer strategy.
As expected, reinsurance structures were scrutinised ahead of the January 2018 renewals, with increased focus on increasing resilience in large loss years, such as 2017 (HIM) or 2005 (KRW). In particular, the efficacy of single-shot covers was assessed and levels of aggregate and retention were recalibrated, in line with available capital and increased risk awareness.
Author:
Junaid Seria is Global Head, cat model R&D and governance, at SCOR and chair of the IFoA Cat Risk Modelling Working Party.